
January 2014, Vol. 241 No. 1
Features
Crossing Invisible Rivers: Seasonal Floods And The Risk Of Pipeline Exposure
The hydrological regime in the Brazilian northeast is variable. There have been in the past many cases of pipeline exposure due to huge seasonal water flow in places where, during dry periods, it’s impossible to even identify the existence of a river. The Petrobras Reabilitações do Nordeste (REAB) Project aimed to analyze a 15-year-old natural gas pipeline network in northeastern Brazil and intervene wherever the operational conditions were considered unsatisfactory. The main points of attention were river crossings.
Studies were executed in different phases. In the first phase, executed throughout 2007, 39 rivers were studied. In the second phase, between May 2009 and April 2010, 45 rivers were studied, including some counted in the previous phase.
The studies analyzed topographic, geotechnical, geophysical, pulse-code modulation (PCM) and hydrological/hydraulic data on the rivers, with the objective of determining the present and foreseeing the future condition of the pipelines, especially the potential for exposure.

Since the pipelines were under operation, the design code was not applicable when it came to the minimum cover of the pipelines. Therefore, a decision flowchart was developed to determine the necessary intervention in each river crossing. This flowchart takes into consideration the present and future condition of the pipeline as well as human activity nearby. A 200-year rain took place right after the studies were finished and only one river behaved differently from predicted. In that case, modeling limitations might be an explanation.
Introduction
The hydrological regime in northeastern Brazil has clearly defined seasons, with prolonged periods of drought followed by heavy rain for a few months. Because of that, the river flow is extremely variable throughout the year, and during the rainy period the erosion potential is significant. That is very likely one of the reasons why in the past there were several cases of pipeline exposure in river crossings, and therefore those crossings were one of the main concerns of the REAB project.
River crossing studies were developed in different phases. The first phase, conducted from January 2007 to December 2007, included visiting 52 rivers. Thirteen of those were excluded from the study either because no potential erosion was observed, or because recent interventions had already addressed the problem.
In the second phase, 45 river crossings were studied, including some crossings from the previous phase. Table 1 sums up the rivers studied per pipeline.

Phase 1
In the first phase, field work included geotechnical soundings every 164 feet; one geophysical section consisting of ground-penetrating radar (GPR) or electrical resistivity tests, depending on local conditions; topographic studies; and PCM geopositioning of the pipeline on the dry area. To determine the erosion potential, hydrological and hydraulic studies were made, mostly based on rain data, since river flow data is rare in the region.
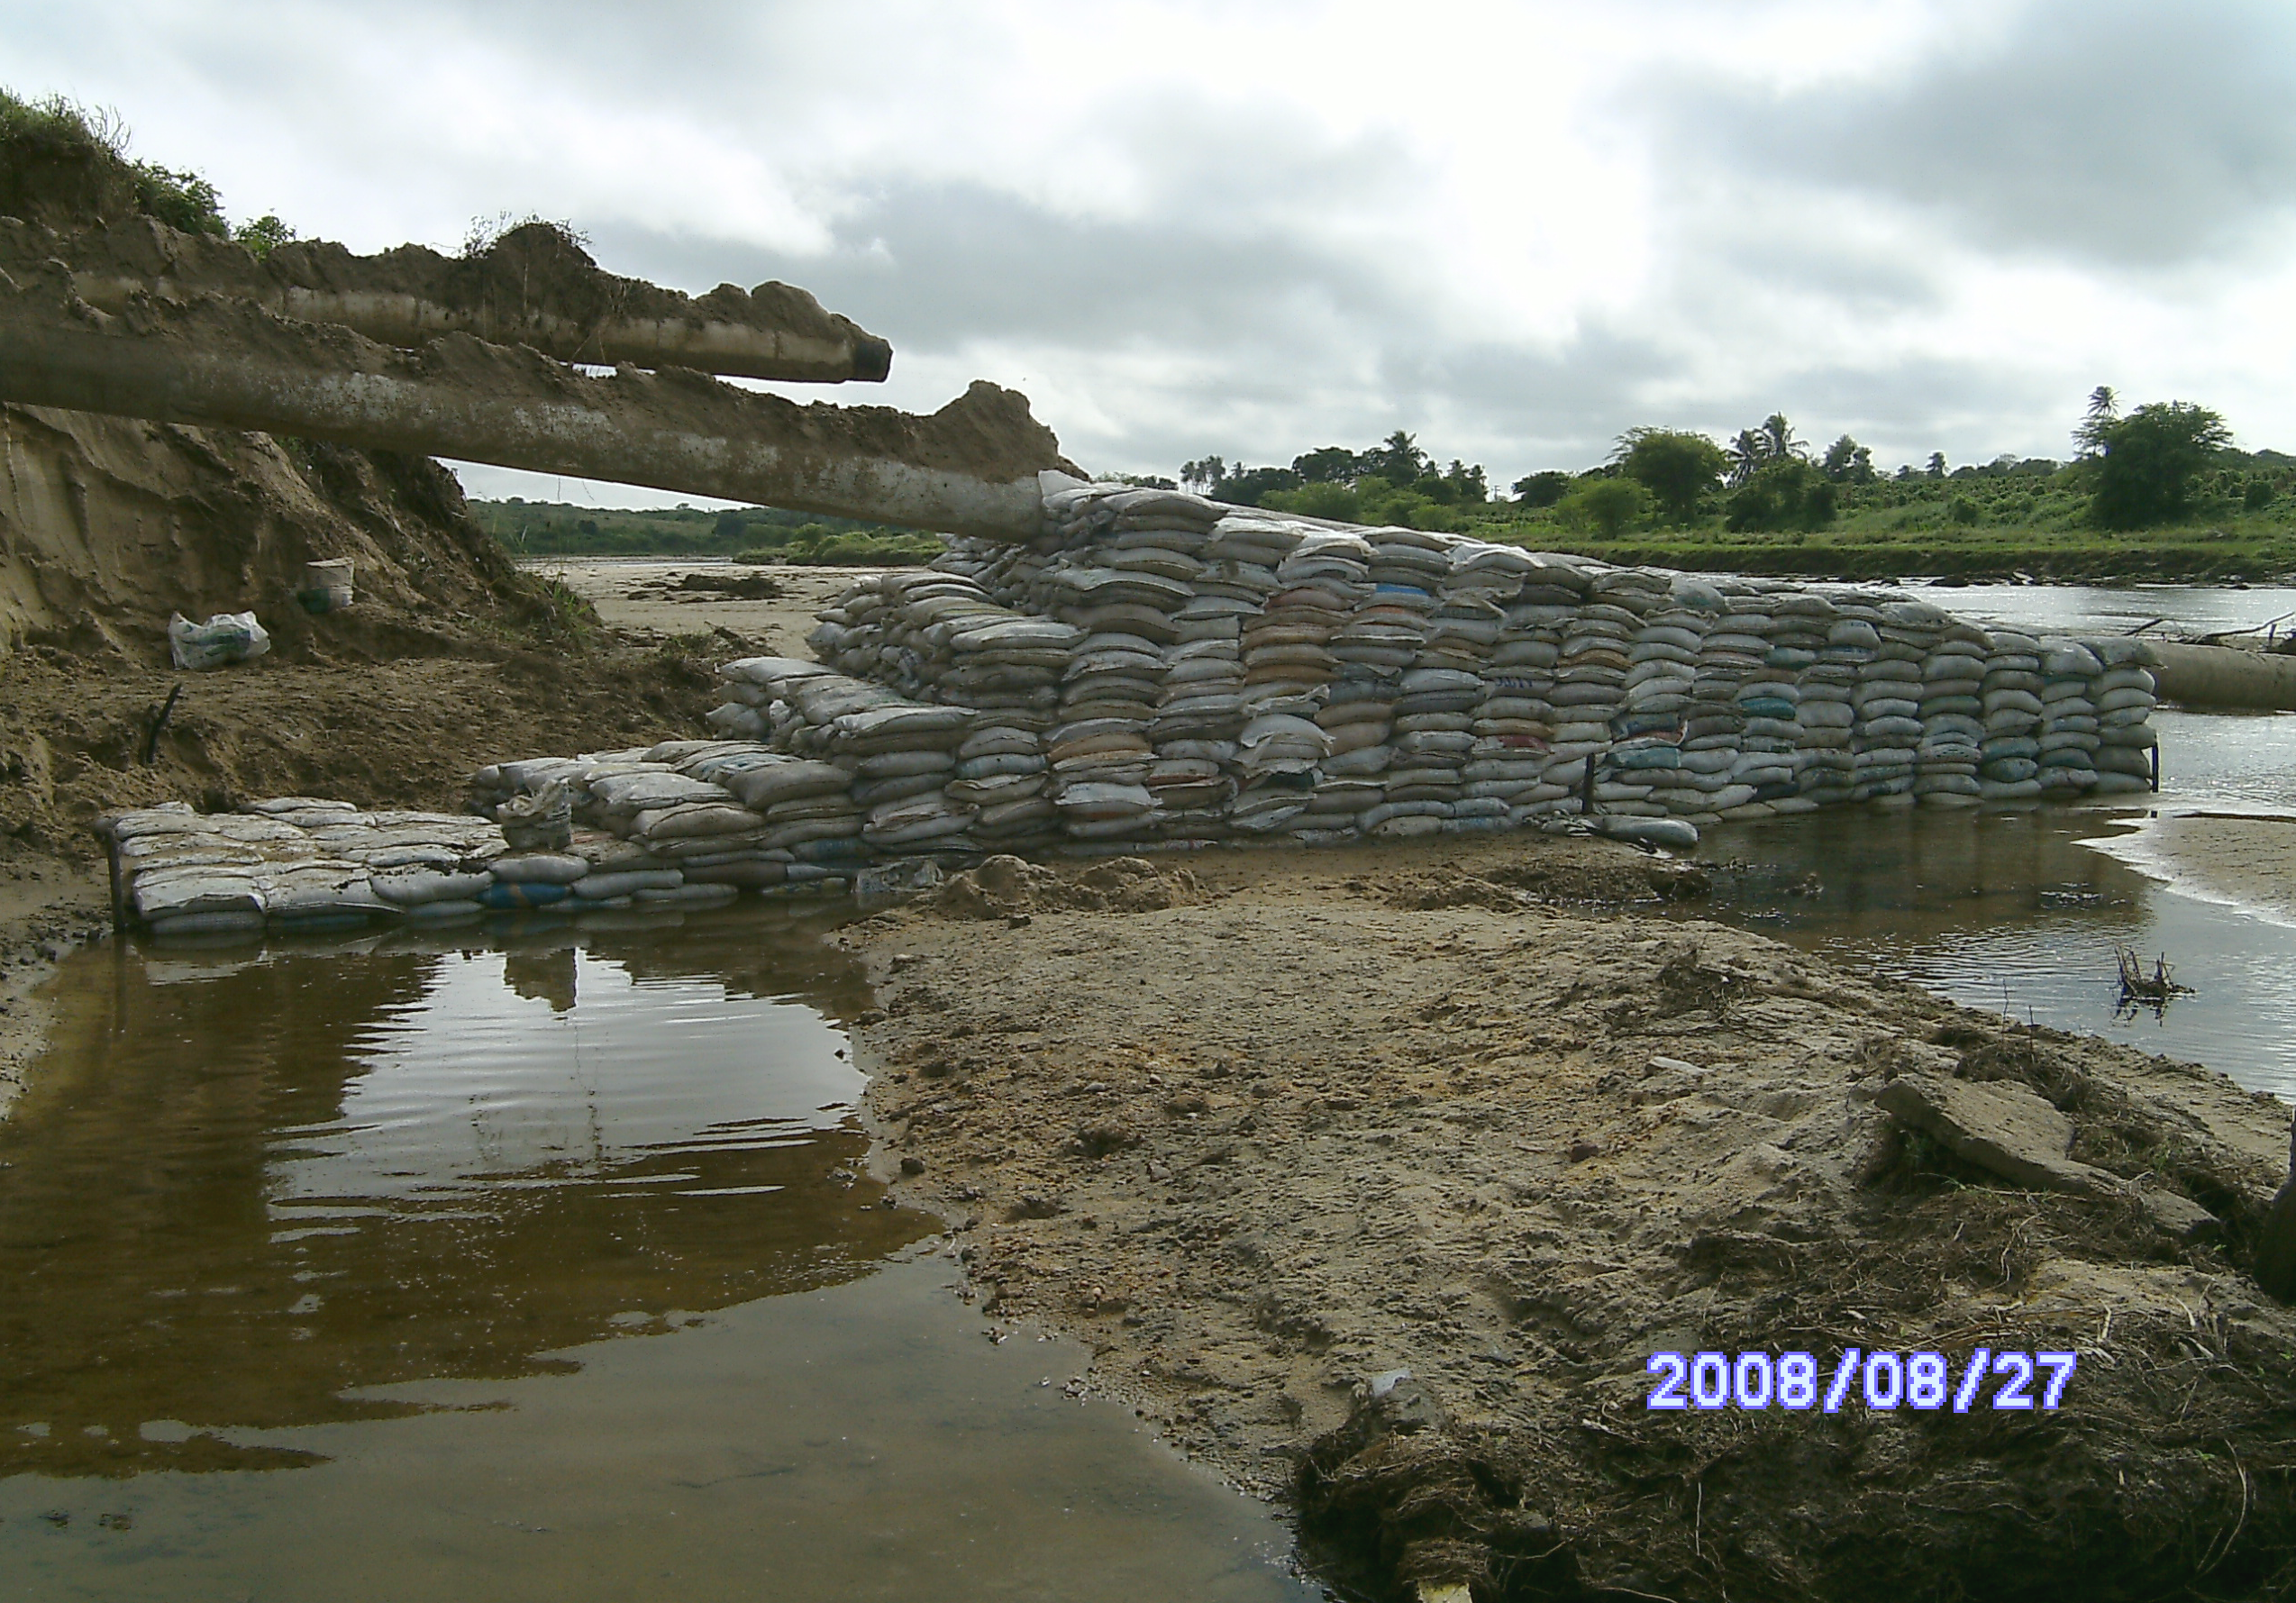
Based on the first phase studies, interventions were undertaken at five crossings using horizontal directional drilling (HDD). Two of those interventions were emergencies, including one at the Potengi river. During the studies the pipeline was not exposed there (Figure 1b), but during the following rain period the pipeline was left unsupported for several yards by the huge fluvial erosion (Figure 1a). In this case, the studies allowed for immediate intervention without need for further data.
Phase 2
Because of the large quantity of data, a method for determining the real need for intervention on many of the river crossings was required. In the second phase, therefore, some crossings were reanalyzed from that point of view.
Besides predicting the future conditions of the crossings, this phase aimed to determine present conditions, including pipeline cover on both dry and wet parts of the crossings and the sort of geotechnical layer in which the pipeline was installed. Only when both scenarios were compared could the risk be analyzed.
When existing data on the crossings was not available, the study team determined positioning using PCM, topography, direct and indirect soundings and hydraulic studies. One of the main difficulties was compatibility of the data from different sources, since not all sources shared the same references. Some existing data had to be abandoned for lack of consistency.
A report and plan were issued for each river crossing. The integrated plan summarized all the data gathered, especially on the positioning of the pipeline and geotechnical information (example in Figure 2). To guarantee the safety of the existing pipelines, the direct soundings were executed some 33 feet from them, so the geotechnical data had to be reinterpreted over the topography.

Analysis Method
The data from phase 2, gathered by contractors, was used by Petrobras’ Pipeline Engineering group to issue a technical opinion as to whether intervention was needed in each river crossing. ASME B31.8S, a standard that presents the model for integrity management of pipelines, does not give details as to how to consider the risks. The main international standard for the integrity of metallic structures, API 579, is focused on mechanical integrity, and does not address the geotechnical risks, among which we can include fluvial erosion.
There was therefore a need to define a method for evaluating those risks, on the assumption, common to many integrity standards, that the values defined on the design standards cannot be blindly used to analyze existing structures. Fit-to-purpose considerations had to be made, and changes in the structures implemented whenever there was a need.
The group developed an analysis flowchart, taking into consideration the erosion risks as well as external risks to pipeline integrity. That flowchart is presented in Figure 3. Considering the present cover, along with the erosion prediction, the possibility of the pipeline being unsupported at any point is evaluated. If the determination is positive, intervention is necessary, since an unsupported extension causes additional stresses on the pipeline and is unacceptable.
If the determination is negative, the remaining cover of the pipeline after the predicted erosion is evaluated. If cover exceeds three feet (one meter), the condition is considered safe; else, the risk of external damage to the pipeline is evaluated – from sand extraction, rolling boulders and so on. If that determination is positive, an intervention is needed to raise the operational safety. The method of intervention depends on the specifics of the river crossing.


Mundaú River Crossing
An interesting case was that of the Mundaú river crossing, for the Gasalp pipeline. The crossing is situated at Rio Largo, AL and is approximately 260 feet wide. The rock basement is shallow, on surface under water, and the soil above is mostly sandy, alluvial.
Hydraulic studies had indicated an erosion potential of up to 260 feet for the right bank of the river. The river bottom was considered stable due to the rock basement, and the left bank was also stable due to the protection provided by an earth embankment built as part of a major road. The pipeline’s cover ranged from 1.31 feet to 9.35 feet. With the predicted erosion, the pipeline could become unsupported on the right bank.
For that reason, a partial change of the crossing was designed, in order to install the pipeline under the rock on the right bank.
The technical opinion for the Mundaú crossing was issued in March 2010. Only three months later, great floods swept the region, causing serious damage to towns along major rivers. Fragoso Jr. et al. (2010) established that it was a rain with a 200-year return period.
As a consequence of the flood, major erosion with pipeline exposure was detected on the left bank of the crossing which had been considered stable, while the right bank was left almost untouched.
What could explain such a difference between predicted and actual behavior? The earth embankment built by the road inside the bigger river flooding area had worked, in our model, as a protection to the left embankment. However, there was in that embankment a small cut, built to allow passage for a railroad that follows the river. The base of that cut was some yards above the normal water level of the river, and far from the pipeline crossing, so for that reason it was not taken into account on the model.
With the increase in the river flow, the water line rose higher than the base cut; consequently, the river started flowing not only through its usual channel, but also through the new one formed by the cut. The erosion later observed, which destabilized part of the road and left the railroad twisted and unsupported (Figure 4), serves as proof to that. The secondary channel passed right through the left bank of the crossing, carrying away the alluvial soil and exposing the pipeline.

As an emergency measure, the left bank was rebuilt to its original conditions. Due to the new data, other options are being studied for that river crossing.
Conclusions
The flood of June 2010, which corresponded to the 200-year rain, influenced at least five of the studied rivers, among which only one presented a different behavior from the one predicted. That difference is attributed to modeling limitations. For that reason, it may be considered that the studies performed, together with the analysis flowchart developed, allowed better decisions regarding interventions on river crossings for existing pipelines.
Acknowledgements
The authors acknowledge Petrobras for the permission for publication of this paper, a form of which was prepared for presentation at the Rio Pipeline Conference & Exposition in September 2011 in Rio de Janeiro and selected for presentation by the technical committee of the event.
References
American Petroleum Institute. API 579 – Fitness for purpose Second Edition. API, 2007
American Society Of Mechanical Engineers. ASME 31.8S – Managing System Integrity of Gas Pipelines Supplement to ASME B31.8. ASME, 2010.
Fragoso Junior, C. R., Pedrosa, V. A., Souza, V. C. B. Reflexões sobre a cheia de junho de 2010 nas bacias do rio Mundaú e Paraíba. 2010

Comments